🔍Reviewing Check Results
Last updated
Last updated
From the Checks page, you can dive into a specific check to read about the check and the failure criteria used to evaluate users, review the recommended remediation actions, see the full list of users currently failing that check and why each user is failing, modify check settings, configure notification settings, and more.
To explore a specific check further, click on either the desired check name, or any part of that row (excluding the "Report Channels" and "Enabled" columns) to see the Check Results page.
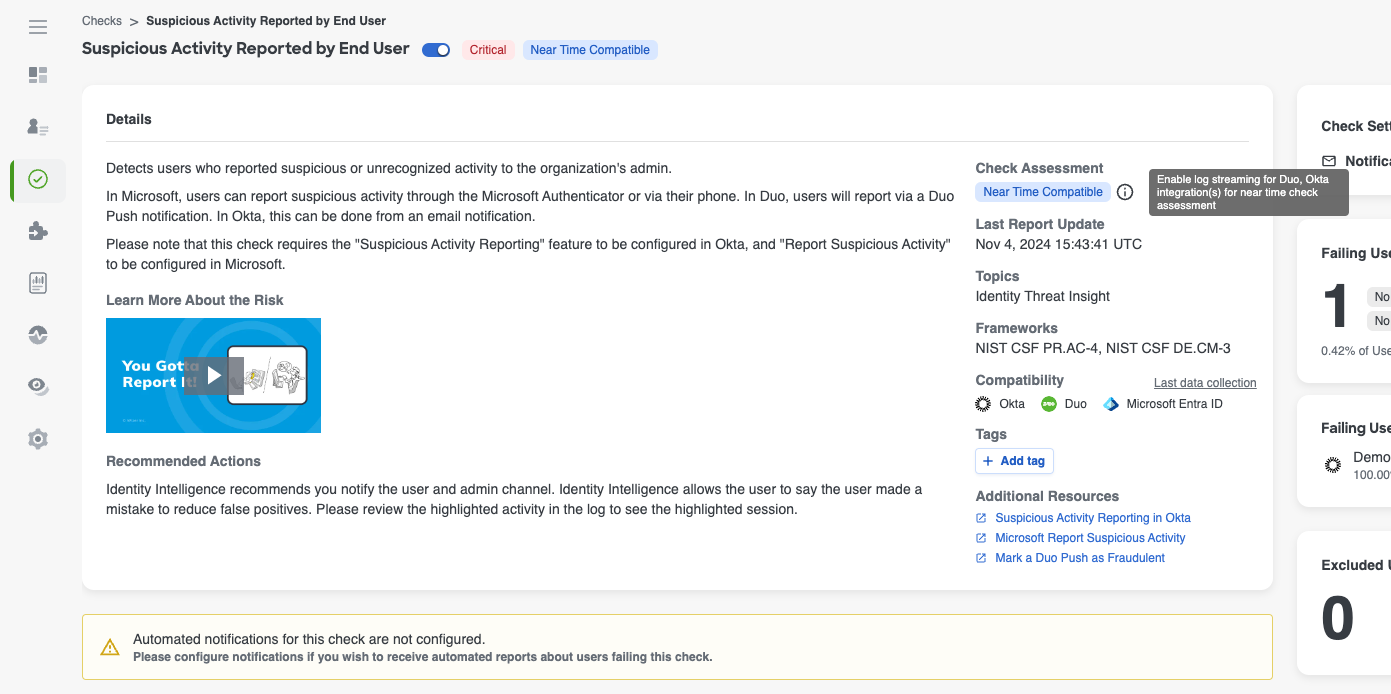
The Check Results page is broken into multiple components:
Check Settings, including customization and notification settings
The Check Details provides high level information about the specific check you are reviewing and encompasses the full block of information that you see on the top of the Check Results page. While the information available will vary from check to check, the format is the same across all checks.
The severity level of each check can be seen next to the Check name, right above the Check Details block.
On the left side of the Check Details block you will see:
Check Description - Information about what a given check is detecting, the logic used to determine which users will fail the check, the potential risk to your organization, etc
Some checks will have a sub-section within the description called Learn more about the risk with a short 1-2 minute educational video explaining the risk of this behavior and why it is important to remediate this failure. If check notifications are set up to contact the failing end user, in certain cases (such as the "No MFA Configured" check), the message sent to end users will include the associated video to teach them about the risk and encourage them to take the necessary action to remediate the problem
Recommended Actions - Information on how you can remediate a given check failure, investigate the problem, and/or improve internal processes or policies to prevent users from failing this check in the future
On the right side of the Check Details block you will see:
Last Report Update (UTC) - The date and time the system last processed identity source data and ran the user analysis for a given check. Hover over this value to see a tooltip with the local time
Topics & Frameworks - Topics lists the category that a given check falls into (threat, posture, compliance). Frameworks lists different security frameworks and guidelines, such as NIST, MITRE &TTACK, CIS, etc, associated with a given check. Both of these fields are available as filters on the Checks page
Compatibility - Shows which identity data sources work for a given check. All compatible data sources are visible, even if they are not configured for your tenant
Tags - Tags can be added to a check for additional custom categorization. Any tags that are applied to a check will be visible in the Check Details block, and can also be used as a filter on the Checks page. Tags are visible to all users with platform access
To apply a tag to a check, click the +Add Tag button in the Check Details block, enter the desired tag name and save
To remove an existing tag, click the X in the desired tag label in the Check Details block
Check Assessment (not available for all checks) - Certain checks are "Near Time Compatible", which means that if log streaming is enabled, the data collection and analysis for this check occurs multiple times a day rather than following the standard 24 hour data collection process. If a check is Near Time Compatible, this field will be visible in the Check Details block.
Log streaming is available for certain integration sources including Okta, Azure and Duo. Configure log streaming to receive notifications about these checks in Near Time.
Certain integrations are only Near Time Compatible with certain checks (ie: a check may be near time compatible for Okta and Duo but not Azure)
Hover over the tooltip next to the Near Time label to see which data sources need log/event streaming enabled to start getting near time assessments for this check. Any data sources that already have streaming enabled will not appear in the tooltip
Additional resources (not available for all checks) - Some checks will have links to external sites with information related to a given check, such as relevant documentation from compatible data sources on data definitions or related configuration instructions, security framework detailed descriptions, etc where you can learn more about the security risk or how to remediate an issue
Under the Check Details block is the list of users currently failing a given check. From this table you can review the users failing a given check, as well as dive into the 'Check Explainability' to learn more about why a specific user failed the check.
Directly above the column headers, you can see a count of the number of failing users and 2 buttons - View Users and Download List.
View Users will take you to the Users page, pre-filtered on the given failing check, so you can see all the users failing that check
Download List will export the list of failing users, and the columns from the table, to a CSV file. It does not include the check explainability for the failing users
If there are more than 1,000 users failing a given check, you will see a button that says View Users which will take you to the Users page, where you can see all failing users and utilize the filters to narrow down to smaller, more manageable groups of users.
The table of failing users contains the following fields :
Element | Description |
---|---|
User | The user key of the failing user Clicking on a user's name will take to you their User 360 Checks tab |
First Reported (UTC) | The date and time the user was reported for failing a given check for the first time To sort by this column value, click the First Reported column header to switch between ascending and descending order |
Last Reported (UTC) | The date and time the user was most recently reported for failing a given check or having a new observation recorded for that check By default, the list of failing users is sorted in descending order (newest to oldest) on Last Reported. To sort by this column value, click the First Reported column header to switch between ascending and descending order |
Admin Notified | The number of times a notification was sent to admins about a given user failing a given check, the notification method used as an icon (slack logo, email icon, etc) and the last date and time a notification was sent for a given user If notifications are not configured for a given check, this column will say 'Not Notified' |
User/Manager Notified | Not supported for all checks. If a check is not compatible with end user/manager notifications, this column will not be visible The number of times a notification was sent to an end user and/or end user manager about the user failing a given check, the notification method used as an icon (slack logo, email icon, etc) and the last date and time a notification was sent for the given user If end user/manager notifications are compatible with a given check but are not configured, this column will say 'Not Notified' |
For Identity Provider checks, like Okta Session Length Policy Compliance
or Apps with Expired Secrets
, the check is evaluated against the integration instance, rather than end users so you will not see a table with failing users. On these checks, you will see Failing Instances, which lists the failing identity data source(s), and additional relevant data items, such as app display names, policy names, etc., that require remediation. You can filter for Identity Provider checks on the Checks page, under the Scopes filter.
On the right hand side of the Check Results page, next to the Check Details block, you will find a Check Settings block, that is collapsed by default. Click the down-arrow in the top right of this widget to expand it so that you can review or modify the check's settings.
Detailed information about the different check settings available, and how to use them, can be found in our Customizing Checks article.
Just like on the User 360 Checks Tab, for each failing check, you can click in and view more information about that particular failing check, along with the most important context, such as the actions that contributed to the user failing a given check and high level context about that user. This is called the 'check explainability'.
The explainability available will vary from check to check based on what information or context is most relevant for a particular check, and can include information such as such as user title, failing data source, factor type, application accessed, IP address used, etc.
To review the check explainability from the Check Results page, click on any blank space in the row related to the specific user you'd like to dig into. This will open a side panel from the right side of the page with the explainability information for that user. To close the side panel, click the X in the top right corner of the panel, or click anywhere outside of side panel.
For event based checks, within the explainability panel, you can jump directly to a given user's Activity tab to get more information by either clicking the View in Activity button to navigate to the Activity tab pre-filtered on all events related to that check failure, or clicking on a See in Context button to go to the Activity tab pre-filtered on events that occurred in the hour directly before and after the check failure.
Additionally, If you click a given user's user key from the table, you will go to that user's User 360 Checks tab, where you can see all the checks the user is failing, review the check explainability, and see the observation history for a check (for event based checks).
From the failing users list, you can also take a few different actions using the 3-dot button on the right side of the row for a given failing user. The actions available are:
Send notification - Sends a one-off notification about a given user's failure to a configured notification channel for Identity Intelligence admins, or the end user/manager if compatible. Notification targets must be configured to use this functionality
View Logs - Takes you to a given user's User 360 Activity tab, pre-filtered on the check failure
Exclude from Check - Removes the user from the list of check failures and stops them from being evaluated against a given check for the specified time frame. Check will appear in Resolved Checks table in Checks tab of User 360
Mark as Interesting and Mark as Normal - Note: Only available for event based checks. Marking a user's check failure or observation as either interesting or normal behavior will mitigate the failed check for that occurrence for that user and move it to the Resolved table in Checks tab of given user's User 360
There are a few widgets on every Check Results page that can be useful to get a high level understanding of the users failing a given check
The number of users currently failing the check, as well as the percentage of users failing compared to the total number of users in your environment. This widget is available on all checks, though it may be replaced with a compliance score for provider based checks.
Within this widget, you can also see how the number of failing users has changed over the last 7 and 30 days expressed as a percent change. Large increases to either of these numbers may indicate something worth investigating such as an active attack, a policy misconfiguration, etc.
The number and percentage of users currently failing a given check, broken down by which identity data source is causing a user to fail. This widget is not available on all checks.
For example, a user with an account in both Duo and Azure may fail the No MFA Configured check because they have MFA configured in Duo, but not in Azure. In this case, the user would be counted under the Azure integration count.
To see which users are failing because of a given source, click on the data source within this widget, which will take you to the Users page, pre-filtered on that specific check and the selected integration. Note: If a user is failing under more than one source, they will be counted under all applicable sources
The total of number of users who have been excluded from a given check, either temporarily or permanently. This widget is available on all checks, except for provider based checks.
Click the number of users in the Excluded Users widget to go to the Users page, pre-filtered on that specific check and excluded users, to review which users have been excluded from a check. Click on a specific user and navigate to their User 360 Checks Tab to see more details about the user's exclusion, or to re-include the user in a check if needed.
The total number of users who are not currently in your designated Protected Population that would be failing this check if they were part of the protected population. This data can be useful to determine if your protected population may be configured in way that is leading to unintended results.
By default, tenants do not have a protected population configured. Click the link above to read our documentation about setting and modifying your protected population.
This widget is available on all checks, except for provider based checks.