> For the complete documentation index, see [llms.txt](https://docs.oort.io/llms.txt). Markdown versions of documentation pages are available by appending `.md` to page URLs; this page is available as [Markdown](https://docs.oort.io/dashboard/posture/identities-dashboard.md).
# Identities Dashboard
The Identities dashboard provides a high-level view into your key metrics about the identities present in your connected Identity Sources. This article provides details on each of the sections or widgets in the Identities dashboard.
The Identities dashboard displays metrics and visualizations on areas of interest including:
* [Posture Score](#posture-scores)
* [Posture Score Trend](#posture-score-trends)
* [User per Trust Level](#user-trust-level)
* [Risky Users Distribution Over Time](#risky-users-distribution-over-time)
* [Identities](#identities)
* [Administrators](#administrators)
## Posture Score
Cisco Identity Intelligence separates posture into three scores. Each score ranges from 0 to 100. Higher scores indicate stronger posture. The Identity Dashboard highlights the Users Score, specifically.
See [Identity Posture Scores](/identity-posture-score.md) for more info on the other category scores, score calculation details, and remediation guidance.
### Posture score recommendations
The Posture Score widget provides the current score for the given posture area. It also shows:
* the score threshold level
* the score change over the last 30 days (+ to indicate an increase and - to indicate a decrease)
* the last date the score was calculated
* prioritized recommendations, including
* the number of entities failing the check associated with the recommendation
* the severity of the issue that is being recommended for remediation
Recommendations are ordered by expected impact on the relevant score. Fully remediating the first recommendation produces the greatest improvement to the given category's score. Although other recommendations may have more entities failing, fully resolving "Priority 1" will lead to a bigger improvement in the score than fully resolving "Priority 4", for example.
Select the number of entities in the 'Failing Entities' counter to go to the Checks page or the inventory page, pre-filtered for the entities failing the selected check, so that you can take action to improve your posture score.
You may see **Configure HRIS** when required HRIS data is missing. Select it to configure HRIS data through [**Integrations**](/integrations.md).
You may see **View Check** when a contributing check is disabled or fails on settings, rather than entities. Select the **View Check** to review the results or enable the check as needed.
### Posture score trend
The trend widget shows changes to the given posture score over time to depict changes to the category-level posture score over time so that you can see and report on your progress, as well as better understand how different events may have impacted the given Posture Score positively or negatively over time.
Hover over a data point, which are marked by a dot on the trend line, to see explainability about why the score may have increased or decreased. The 3 attributes that contributed most to the score change will be displayed when you hover on a specific data point.
By default, this widget looks at the last 30 days; however, you can use the timeframe filter in the top right-hand corner of the widget to change the widget's timeframe to be longer or shorter depending on your needs.
## User Trust Level
User Trust Level looks at different components that make up user risk, such as on a user's context, behavior and common tendencies, to calculate a single User Trust Level. Trust Levels allow you to quickly and easily pick the riskiest users out of the crowd, so that you can investigate with urgency and remediate the situation as quickly as possible, reducing the attack timeframe or even preventing an attack from happening in the first place.
To learn more about User Trust Levels, what factors are included in the calculation, how it is calculated, and more, see our documentation about [User Trust Levels](/user-trust-level.md).
There are two widgets in the Dashboard related to User Trust Levels which are described below.
### Users per Trust Level
The Users Per Trust Level widget displays the current breakdown of the number of identities in each Trust Levels across your organization.
Not only does this graph give you a sense of where your users are at today, but it is also a quick and easy way to find users for investigations. Selecting one of the bars in this visualization will take you to the Users page, pre-filtered for the Trust Levels selected, so you can see all users who currently have a particular Trust Level.
### Risky Users Distribution Over Time
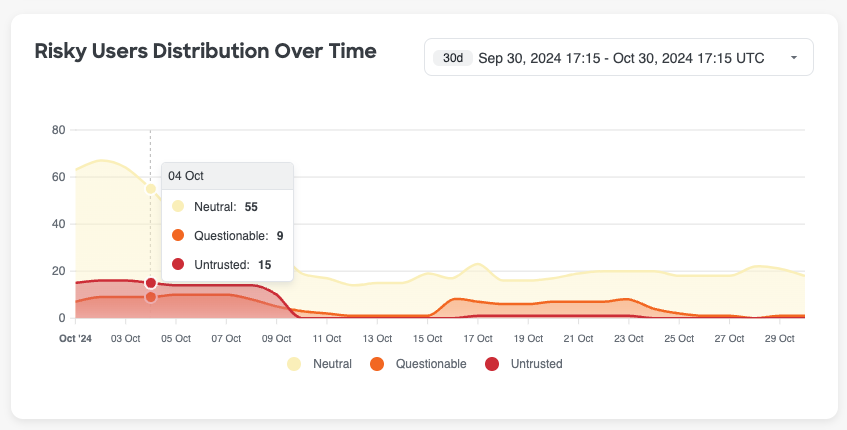
The second widget, Risky Users Distribution Over Time, depicts fluctuations to the trust levels of the users in your organization over time. This widget can be useful to identify sudden spikes in User Trust Levels.
If you hover over a data point in this widget, which are marked by a dot on the trend line, you will see a tooltip with the count of users, segmented by Trust Level, for that given date.
By default, this widget looks at the last 30 days; however, you can use the timeframe filter in the top right-hand corner of the widget to change the widget's timeframe to be longer or shorter depending on your needs.
Selecting a value in the legend below the graph will remove the corresponding data points from the visualization.
## Identities
**Purpose & Benefit**: Multiple Identity themed widgets to make it easy to quickly assess the size of your total identity estate, as well as recent trends in your identity hygiene and security posture.
### Identity Security Snapshot
The Identities widget provides total identities, protected population metrics, and key metrics around identity hygiene and threats, such as -
* Inactive Guest Accounts
* Never Logged In accounts
* Inactive Account Probing
* User Type Missing in user profile
You can select any of these numbers and it will take you to the corresponding Check details page or to a pre-filtered Users Page for further investigation.
### Users per Source
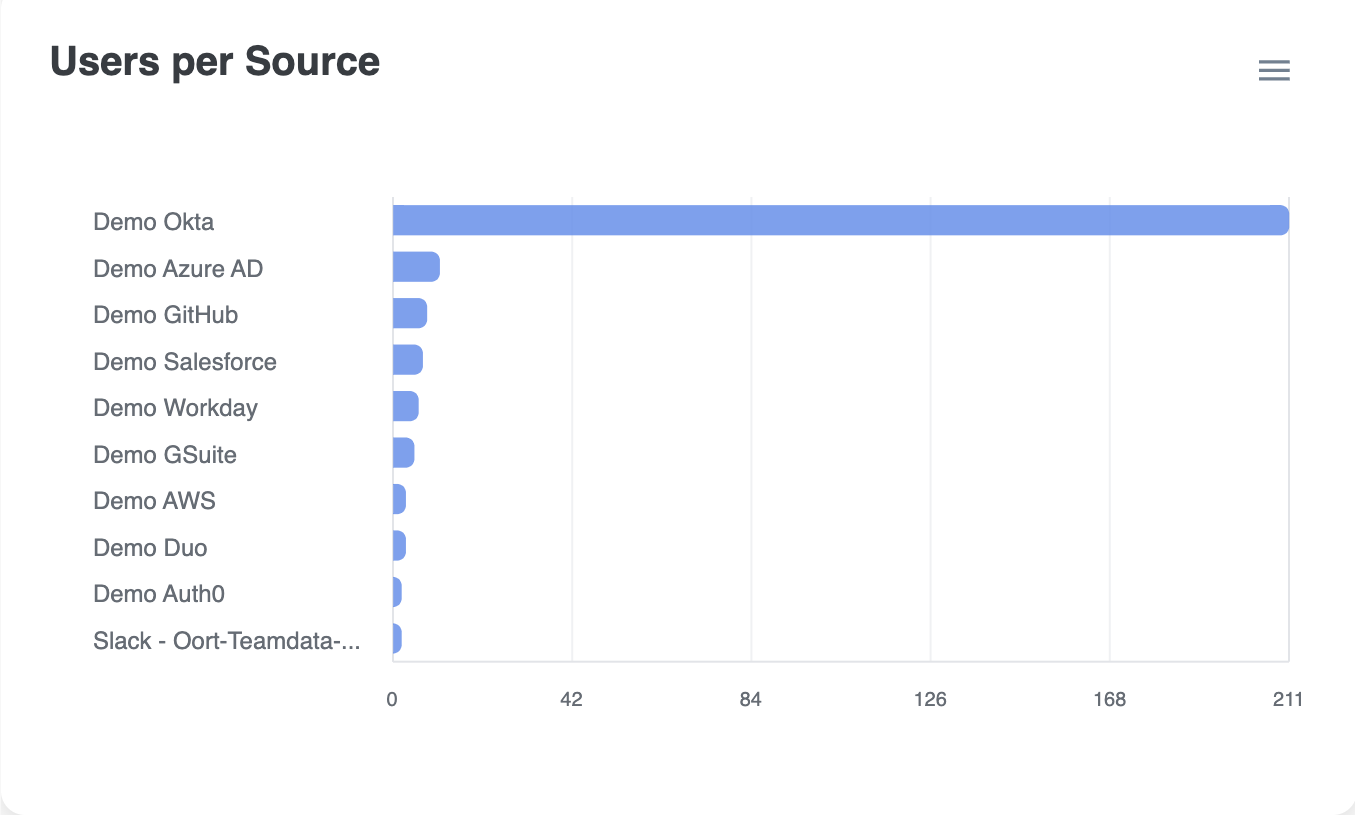
The Users per Source widget further down the dashboard provides a breakdown of the number of identities in each connected identity platform.
Selecting one of the bars in this visualization will take you to the Users page, pre-filtered for the users derived from the selected integration.
### Monthly Sign-ins
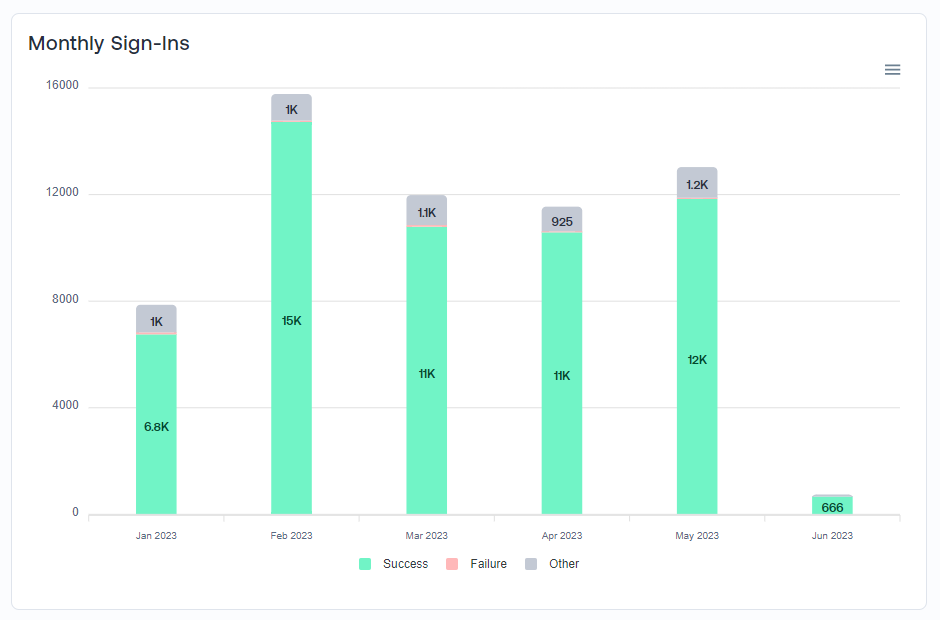
This widget provides details on the total number of monthly sign-ins, including a breakdown of success, failure, and other types of sign-in events.
Trends can be analyzed for changes, such as a high spike in failures or overall sign-in events.
## Administrators
**Purpose & Benefit:** Quickly answer an often difficult question for organizations - how many administrators do I have in each platform and where are they logging in from recently?
The Dashboard contains a couple widgets to highlight the administrators within your environment, as well as their recent activity, since these users have higher privileged access to your IDPs and present a higher security risk if their accounts were to be compromised.
### Administrators per Source
The Administrators per Source widget provides a breakdown of the number of Admin users in each connected identity platform.
Selecting any of the bars in this visualization will take you to the Users page, pre-filtered for administrators of that specific integration.
### Administrator Logins
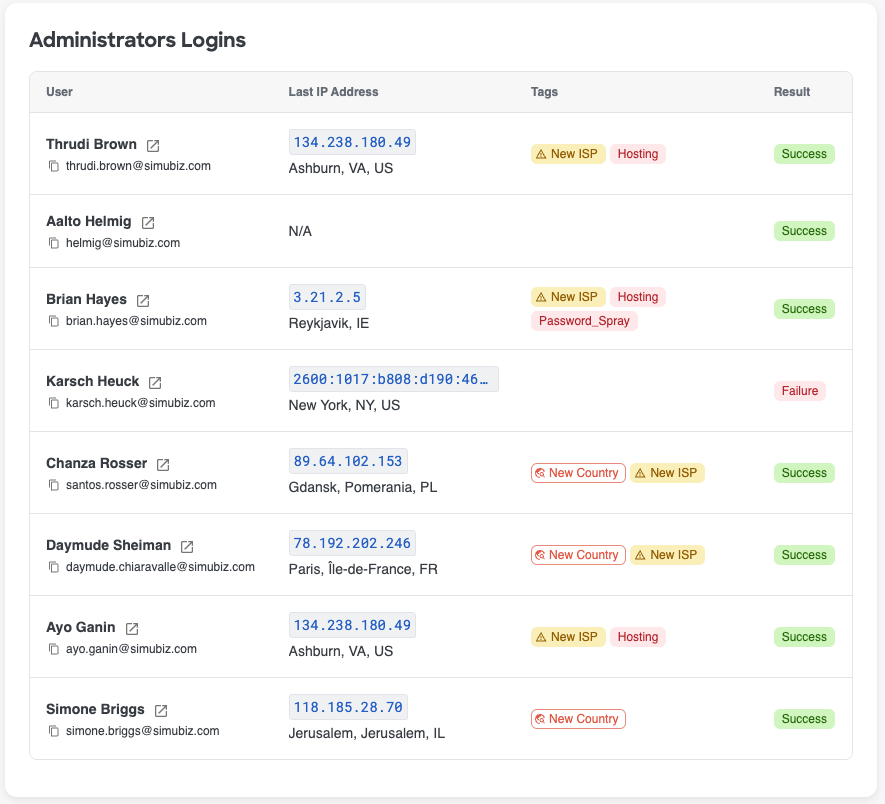
**Purpose & Benefit:** Quickly monitor activity and spot admin account logins from unexpected networks and locations, including ones that have been tagged with a poor IP reputation or other alerts.
The Administrators logins widget shows a log of each Administrators most recent log in activity, including the user's name, email address, the IP address for their last login and the IP location, any tags for that IP address, and the sign in result - Success, Failure, etc
Selecting the blank space of a row or the 'open in new tab' icon next to the Admin's name will open the Admin's User360 in the same window or a new tab, depending on what is selected.