> For the complete documentation index, see [llms.txt](https://docs.oort.io/llms.txt). Markdown versions of documentation pages are available by appending `.md` to page URLs; this page is available as [Markdown](https://docs.oort.io/dashboard/posture/applications-dashboard.md).
# Applications Dashboard
The Applications Dashboard contains information focused on application usage within your environment. Removing user access from unused applications, especially for sensitive or critical business applications, can not only help your organization save on licensing costs, but also improves its security posture by reducing the "blast radius" associated with malicious access to unnecessary applications in the event of an account compromise.
The Applications Dashboard aggregates data from the Applications page to surface insights regarding your org's app hygiene. Refer to [Applications](/applications.md) for more details about the Apps page and the data displayed there.
### Life Cycle
This widget acts as a health check of the organization’s application inventory. Rather than serving as a simple count of apps, it helps show how much of the environment is actively governed, how much has been formally brought under visibility and review, and how much may be inactive or ready for cleanup.
Highlights whether application management is keeping pace with change. A healthy lifecycle picture supports stronger oversight, reduces the chance that forgotten or retired applications continue to create access risk, and helps teams focus review efforts on the parts of the application landscape that may need onboarding, validation, or deprovisioning.
Select any of the numbers in this widget to drill down into the relevant Applications.
Displays:
* Total number of applications
* Number of onboarded applications - Apps that have been newly brought into Identity Intelligence via your connected identity sources and are still in their early monitoring window
* Number of deactivated applications - Apps that have been deactivated at the identity source and can no longer be used
* Number of applications that have keys that are about to expire
* Number of applications with expired secrets
### Access & Entitlement
Shows how application access is being granted across your environment, and where that access might no longer match real usage. Rather than just counting applications, it helps surface patterns that matter for governance: applications that are broadly available, applications with explicit user assignments, and applications that appear assigned or available but are not being used.
Use this data to spot potential over-entitlement, stale access, weak access controls, or process and automations issues before they become security problems. It helps answer questions like: Which apps may be exposed more widely than intended? Where are users retaining access they do not need? In that sense, the graph supports least-privilege decisions, access reviews, and overall reduction of unnecessary risk.
Select any of the numbers in this widget to drill down into the relevant Applications.
Displays:
* [Not accessed applications](#not-accessed-applications-over-time) - Apps that have 0 activity over the last 30 days (by default). The inactivity threshold can be modified using the [custom detection settings](/understanding-check-failures/customizing-checks.md#custom-detection-settings) on the "Applications with Limited Adoption" check
* Applications with no assignment required - Access to these apps is not restricted to certain groups. These apps can be accessed by any user in your organization
* Assigned but unused applications - Apps that have been used by fewer than 90% of the assigned users within 30 days (by default). The usage threshold can be modified using the [custom detection settings](/understanding-check-failures/customizing-checks.md#custom-detection-settings) on the "Applications with Limited Adoption" check
* Applications with Limited Adoption
* Applications with [Directly Assigned Users](/understanding-check-failures/oort-insights/identity-posture-management-insights/user-has-directly-assigned-application.md)
### Application Utilization
This chart shows how assigned applications are being used in your organization in the last 30 days so you can easily visualize your org's current state as it relates to app usage. Its value is not just in showing activity levels, but in helping separate applications that are actively supporting the business from those that might be over-provisioned, neglected, or carrying access that no longer reflects real need and require remediation action.
Low-utilization or unused applications can indicate unnecessary entitlements, stale assignments, procedural issues with new account onboarding or lateral employee movement, or forgotten integrations. These apps can increase the attack surface without delivering much operational value. Use this data to help you prioritize where to review access, validate ownership, tighten application hygiene, and focus cleanup efforts on the applications most likely to present avoidable risk.
To restrict the visualization to only [sensitive application](#sensitive-applications-activity) data, slide the toggle above the chart to **Enabled**.
Hovering over a segment in the pie chart will display a tool tip with the given utilization level and the count of apps making up that segment. To see which apps make up a given utilization level, select either the desired "slice" from within the pie chart or select the desired utilization level from the chart's key to navigate to the App page pre-filtered on your selection
### Application Reports Available for Download
Download a report in CSV format that shows applications with multiple keys. This report can also be accessed and downloaded via the Reports page found in the left hand menu.
### Least Used Applications
Displays the applications that are widely assigned but seeing little real activity in the last 30 days, by comparing the number of accounts assigned vs utilized. At a high level, this widget surfaces your lowest adoption apps (largest deltas between utilized and assigned) so that they can be prioritized for removal so that you can reduce your org's attack surface and tighten access hygiene.\
\
Because of their incredibly low usage levels, and their high assignment levels, these apps are typically lower risk to remove because the change will not impact a large segment of users. They are also likely incurring high license costs that can be recovered by removing the app and ending the agreement with the vendor.
Selecting either segment - 'using the application' or 'not using the application' - of one of the bars in the visualization will take you to the Users page, pre-filtered for the selected application and accounts associated with your selection. Using this granular data can help inform the appropriate remediation action such as removing dormant accounts completely, revoking unused access, or confirming whether an entire application is still needed.
### Application Types by Source
Shows how the organization’s application footprint is distributed across your connected identity sources. Instead of viewing all applications as one undifferentiated inventory, this widget shows where different kinds of applications are coming from so you can spot how much of your environment is centrally managed versus being harder-to-govern or service-driven. It can also highlight possible configuration issues that allow end users to add unapproved apps to your environment, unintentionally introducing an additional data risk vector.
A source with a large share of unmanaged or service-oriented applications can indicate weaker visibility, less consistent governance, or more opportunities for non-human or indirect access to accumulate without review. You can use this graph to identify which sources deserve closer attention, prioritize cleanup and access reviews, harden IdP configuration settings, validate onboarding coverage, and focus security controls where application sprawl or governance gaps are most likely to create risk.
Selecting a given segment of one of the bars in this visualization will take you to the Apps page, pre-filtered for that specific source and app type. Selecting a value in the legend below the graph will remove the corresponding data points from the visualization entirely. Select the removed value in the legend again to add it back to the visualization.
### Application Access by Source
Helps you understand how application usage is distributed across your identity sources, not just how many applications exist in each. At a glance, it shows which sources are driving real user activity and which are mainly contributing stale, low-value, or potentially unnecessary application access.
This matters because application sprawl often hides in disconnected systems. By comparing access patterns across sources, an administrator can quickly identify where to focus cleanup, access reviews, and source validation efforts. In a security-conscious environment, that makes it easier to reduce unnecessary exposure, spot areas where access may be over-provisioned or poorly governed, and make better decisions about which sources and applications deserve closer attention.
Selecting a given segment of one of the bars in this visualization will take you to the Apps page, pre-filtered for that specific source and app type. Selecting a value in the legend below the graph will remove the corresponding data points from the visualization entirely. Select the removed value in the legend again to add it back to the visualization.
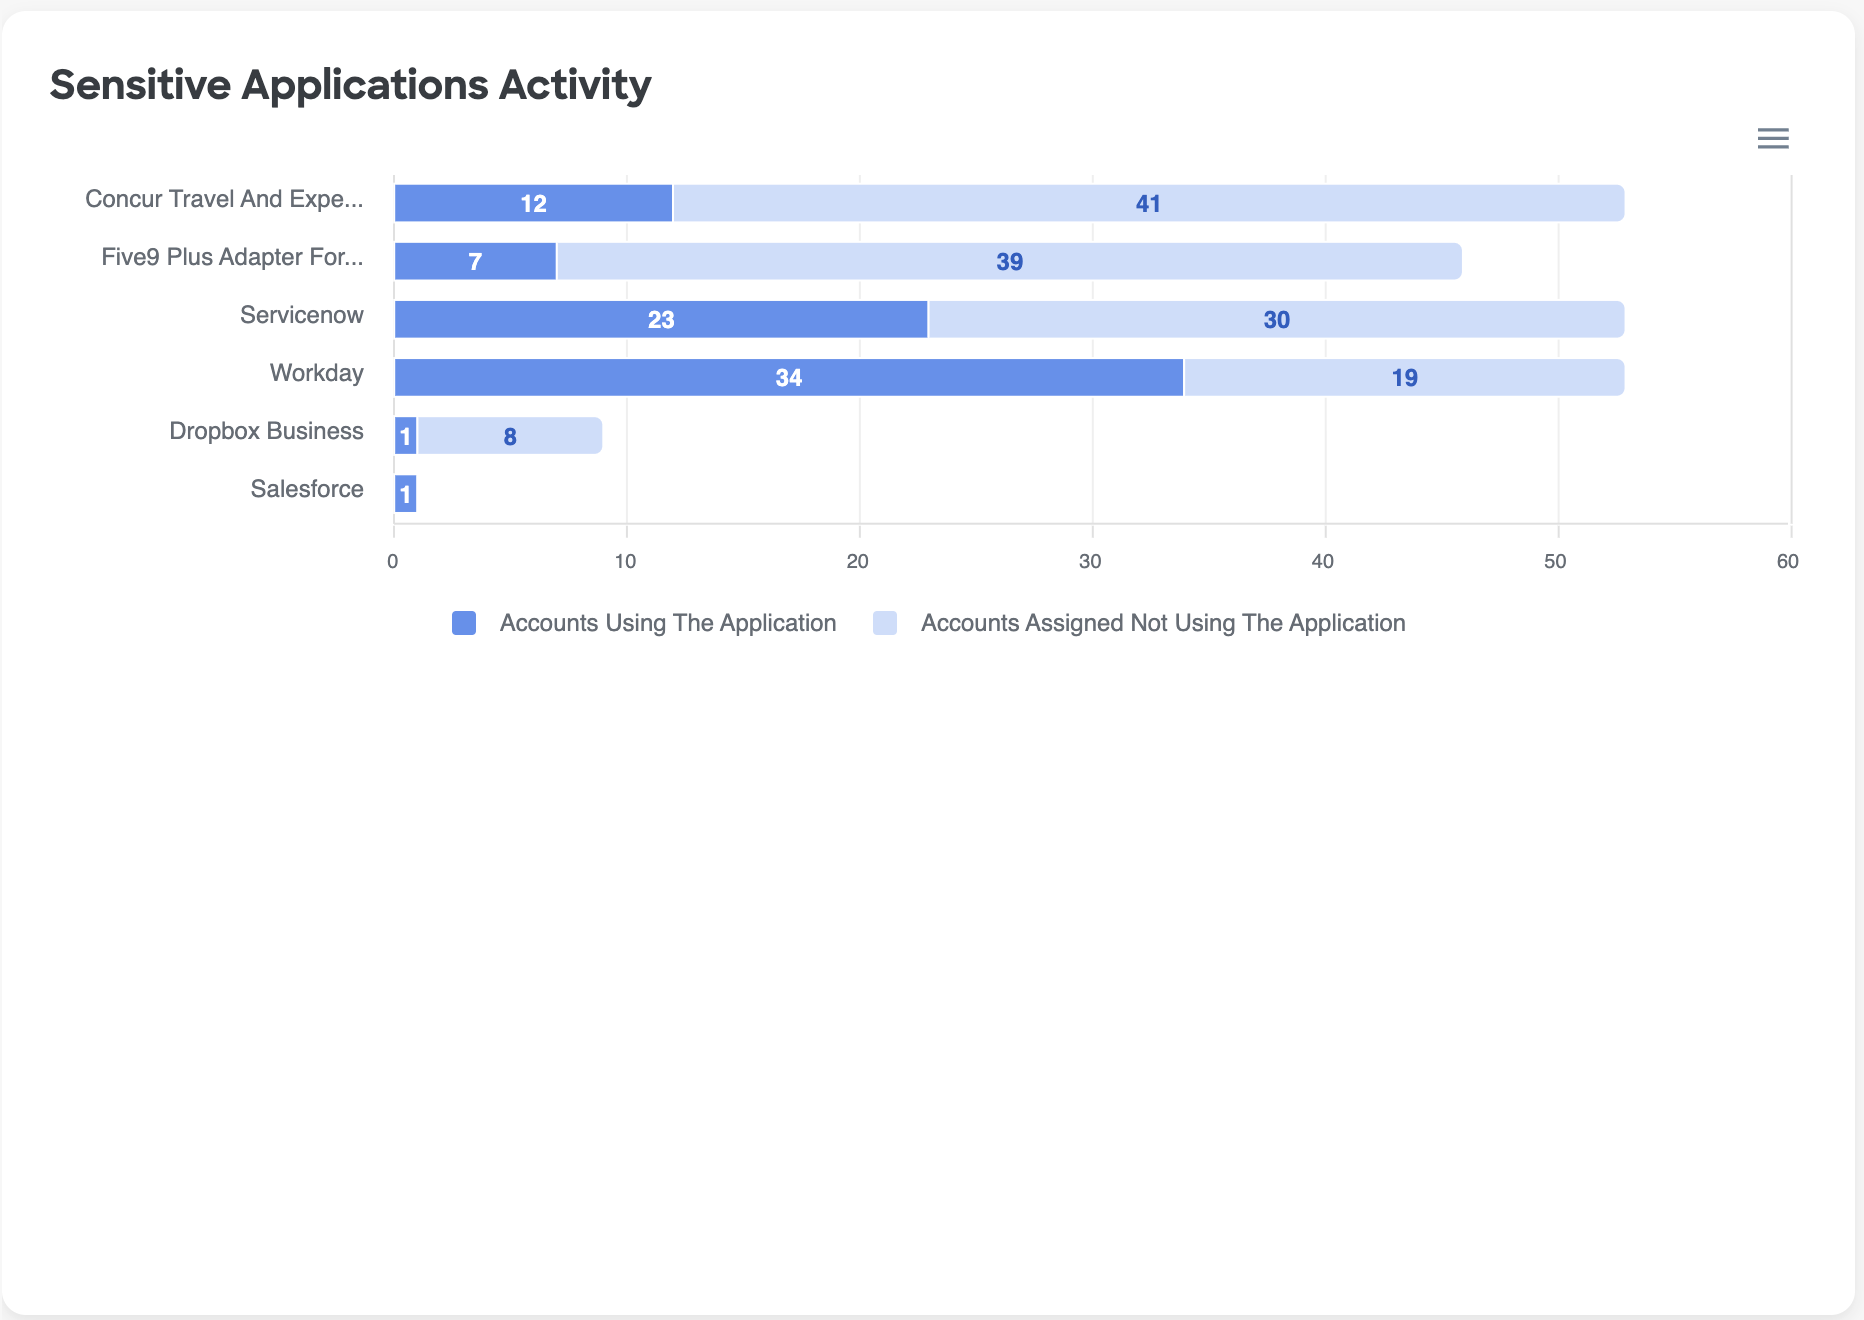
### Sensitive Applications Activity
**Purpose & Benefit:** Highlights users who could be deprovisioned from [sensitive applications](/applications.md#applications-table-elements), reducing the overall attack surface and the blast radius for a given account should it be compromised, while also reducing license costs for your organization.
The Sensitive Applications Activity widget provides a breakdown of the number of accounts who are assigned an application and are using that application compared to accounts not using the application.
To customize the list of sensitive applications to align with your organization's preferences, go to the Applications page within the platform. Documentation on how to configure your sensitive applications list can be found [in the Apps page documentation](/applications.md#adding-sensitive-applications).
Selecting either segment - 'using the application' or 'not using the application' - of one of the bars in the visualization will take you to the Users page, pre-filtered for the selected application and user segment. Selecting a value in the legend below the graph will remove the corresponding data points from the visualization entirely. Select the removed value in the legend again to add it back to the visualization.
### Risky Users Accessing Sensitive Applications
This widget depicts the number of users with neutral, questionable, and untrusted trust level that are accessing sensitive applications over time.
Users with [lower trust levels](/user-trust-level.md#calculation-of-trust-level) should be investigted if they have accessed [sensitive applications](/applications.md#applications-table-elements) because there are indicators of risky behavior associated with their accounts. For example, an `untrusted` user might have a compromised account. This user, in turn, might be leaking customer data, modifying employee personally identifiable information (PII), or downloading sensitive company info like financial records or intellectual property, from sensitive apps as part of their attack.
By default, this widget looks at the last 30 days; however, you can use the timeframe filter in the top righthand corner of the widget to change the widget's timeframe to be longer or shorter depending on your needs.
### Not Accessed Applications Over Time
Tracks the number of applications that remain assigned, connected, or visible in the environment but are no longer being actively used. You can use this trend to easily track and demonstrate your org's progress with removing applications that have not been accessed from its app inventory, as well as monitor if the number of unused apps is starting to increase again - warranting another clean up effort.\
\
This view is useful for improving both security hygiene and access governance. A rising or consistently high trend can signal opportunities to review whether applications should still be onboarded, assigned, or monitored as active parts of the environment. It helps you prioritize conversations about deprovisioning, ownership validation, licensing efficiency, and the removal of dormant access paths before they become overlooked risk rather than treating unused access as harmless clutter.
### Directly Assigned Applications Over Time
Tracks the number of users that are directly assigned to applications over time so you can track your org's progress with remediating this issue and monitor for sudden spikes or gradual increases that require attention. Use this data to identify growing access-management risk, prioritize cleanup toward group-based access, and watch whether exceptions are becoming more common, especially for sensitive applications.
It is best practice to manage app access using automated, scalable group or policy-based controls rather than one-off user assignments to reduce the manual overhead associated with off-boarding users, managing lateral org shifts or IT help desk tasks to grant user access. If your organization has automated workflows upon user termination, these will often fail when direct access to an app is granted, potentially leaving an unprotected, backdoor account open that bad actors can leverage access your environment.